Which renovation trends are most worthwhile?
From keeping up to date with the latest industry trends to unearthing the best tool brand, there’s a lot to consider when carrying out home renovation projects. Houses and housing continue to rise in price across the US. It’s more important than ever for sellers to make their property stand out. However, not all renovations, remodels, and improvements add to your home’s resale value. We reveal which trends are most worthwhile.
Pro Tool Reviews compiled a wealth of data to help you understand which home improvements are the most financially secure. We include everything, from the cost recovery when you eventually sell your home to a breakdown of the average home improvement cost per project type. We also cover which home improvement projects are trending the most on social media and those being Googled the most in each state.
Having the right tools is crucial if you want to carry out some home improvements yourself. Ensure you’ve got the basics covered. Check out recommendations like our best cordless drills article so you can tackle everything from simple installations to more complex renovations.
Updating or adding water heaters and garbage disposals are among the most common home improvement projects in the US, with more than 16 million carried out over two years
More than $641 billion has been spent on home improvement projects across the US in just two years. However, which types of projects have contributed the most to this total? To determine this, we collected national data on the total activity for various projects over the most recent two-year period available.
The most common home improvement projects in the US
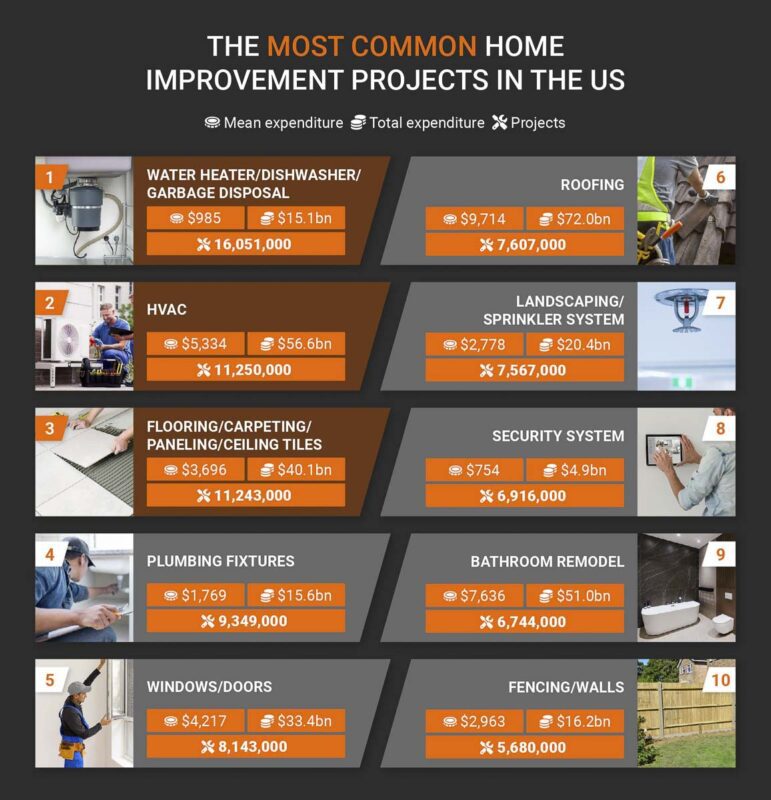
1. Water heater/dishwasher/garbage disposal – 16,051,000 projects
According to the most recent data, adding or replacing water heaters, dishwashers, and garbage disposals are the most common home improvement projects in the US. The data shows more than 16 million related projects in the past two years. Although these projects may be cheaper than some of the other entries on our list, they will still cost an average of $985 to complete.
2. HVAC – 11,250,000 projects
HVAC is next on our list, encompassing heating, ventilation, and air conditioning. Despite being the most costly of the entries in our top three, totaling an average of $5,334 per project, this type of home improvement is the second-most common. We found more than 11 million separate HVAC-related projects across the US over the span of two years.
3. Flooring/carpeting/paneling/ceiling tiles – 11,243,000 projects
With 11,243,000 individual projects across the US, adding, modifying, or renovating flooring, carpeting, paneling, and ceiling tiles represent the third most popular home improvement activity. From upgrading your ceiling to renovating your floors, all of the above projects are extremely important for protecting the longevity and feel of your home.
With more than 62,000 per 100,000 people, Denver has had more home improvements than any other major US city
The following list on our report reveals which US areas are home to most home improvement projects. Here’s what we found.
US cities with the most home improvement projects
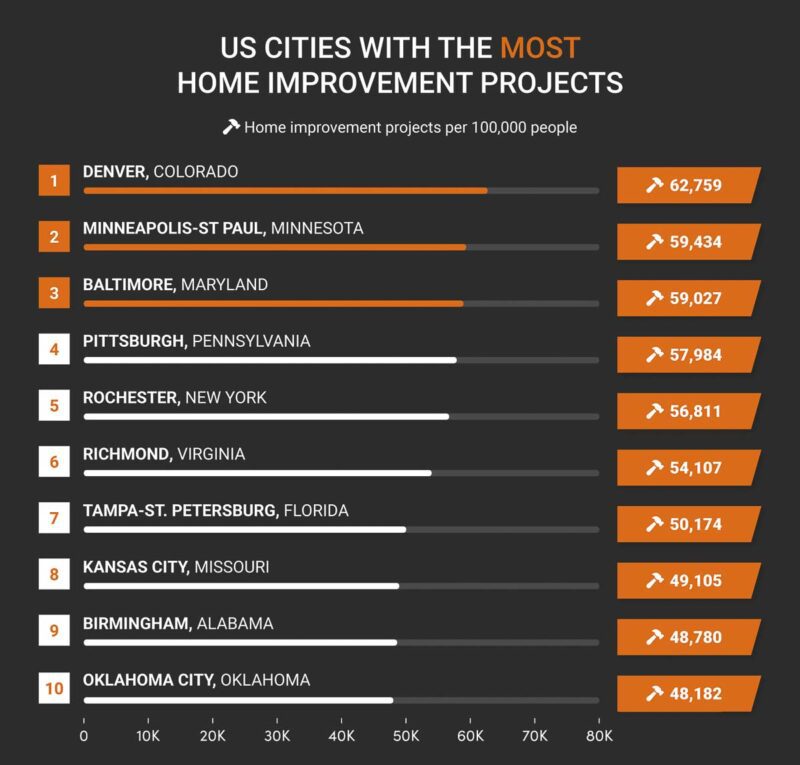

1. Denver, Colorado – 62,759 projects per 100,000 people
Denver tops the list with 62,759 home improvement projects per 100,000 people. The city’s booming real estate market and significant population growth over the past decade have driven many to invest in home renovations. Recent surges in home values often encourage homeowners to enhance their properties. Denver’s active lifestyle and focus on sustainability could also prompt residents to add eco-friendly features. Outdoor living spaces also complement the city’s mountainous backdrop.
2. Minneapolis-St Paul, Minnesota – 59,434 projects per 100,000 people
Coming in second, the Minneapolis-St Paul area has recorded 59,434 home improvement projects per 100,000 people. Known for its harsh winters, homeowners in the Twin Cities may be prioritizing renovations that improve energy efficiency. This includes upgrading to better insulation and window replacements. Additionally, the area’s diverse architectural styles, from historic Victorian homes to modernist designs, give many opportunities for unique renovations, preserving and enhancing these structures.
3. Baltimore, Maryland – 59,027 projects per 100,000 people
Baltimore follows closely with 59,027 projects per 100,000 people. Its rich history is reflected in its many historic homes and buildings. These often require updates to meet modern standards while retaining their historic charm. Urban renewal efforts and community development projects may also be contributing factors as residents and investors seek to revitalize neighborhoods and increase property values through improvements.
New Yorkers spend the most money on home improvements at over $37 billion
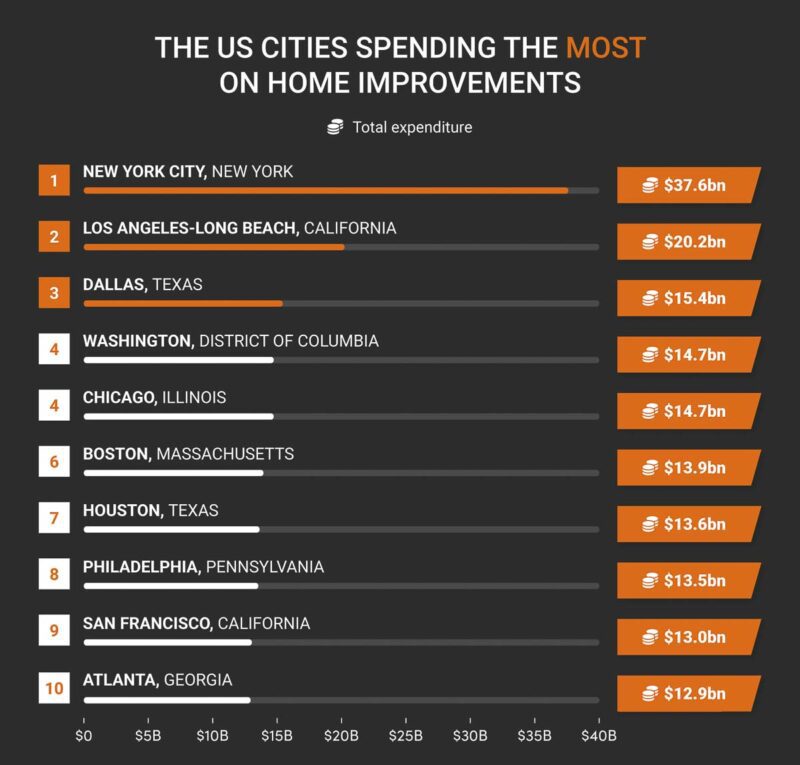

1. New York City, New York – $37.6 billion overall expenditure
As the top spender, New York City spent $37.6 billion on renovations over two years, averaging $7,087 per project. This investment shows the ongoing demand for upgrading and maintaining living spaces in one of the world’s most dynamic cities, known for its high property prices.
2. Los Angeles-Long Beach, California – $20.2 billion overall expenditure
Following closely, the Los Angeles-Long Beach area in California reported a total spending of $20.2 billion and a mean expenditure of $6,824. This sprawling Southern California area has a strong market for home renovations. We see an emphasis on luxurious and modern living spaces, which likely drives this high level of investment.
3. Dallas, Texas – $15.4 billion overall expenditure
Dallas, with total spending reaching $15.4 billion and an average spending of $5,165, stands out in the third position. The city and its surrounding areas are experiencing economic growth and an expanding real estate market, meaning there are lots of homeowners looking to invest in enhancing their property.
New Orleans has the lowest renovation spend, $1.7 billion
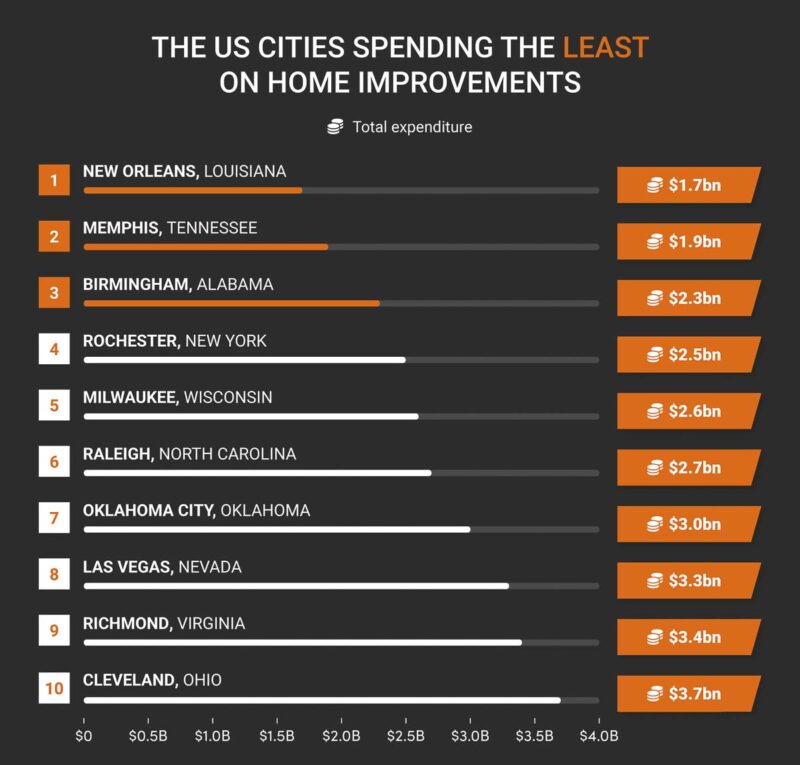

1. New Orleans, Louisiana – $1.7 billion overall expenditure
New Orleans reported the lowest total home improvement expenditure among the cities listed, with $1.7 billion spent. Despite the relatively high mean expenditure per project, the overall lower spending reflects the smaller scale of the housing market and the economic challenges that might affect larger-scale investments in the area.
2. Memphis, Tennessee – $1.9 billion overall expenditure
Memphis had slightly higher total spending than New Orleans, with $1.9 billion in home improvements. The mean expenditure per project was also modest, indicating a steady market for home renovations.
3. Birmingham, Alabama – $2.3 billion overall expenditure
Birmingham stands just above Memphis and New Orleans, with a total expenditure of $2.3 billion. The average spending per project suggests a consistent demand for home improvements, but less than in the larger cities. Interestingly, each of these bottom three cities is located in the South.
Colorado is the most likely state to renovate its homes, with over 55,000 projects per 100,000 people
So, having seen which of the country’s biggest cities are spending the most on renovation projects, which states are looking to freshen things up the most? Here’s a look at the US states completing the most projects (for which recent data is available).
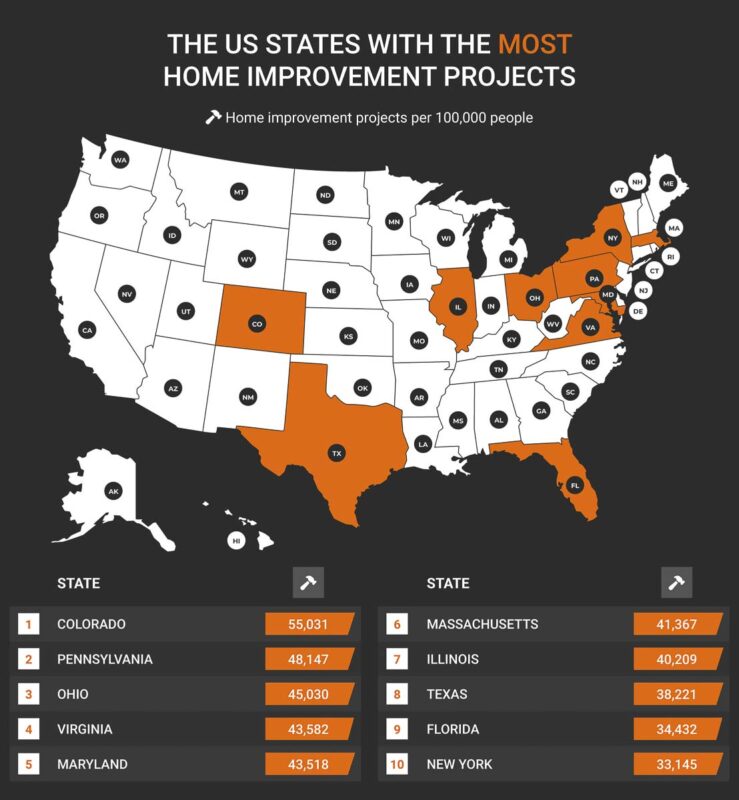

1. Colorado – 55,031 projects per 100,000 people
Colorado comes first, with 55,031 projects per 100,000 people. With a growing population (many people moving there for its scenic beauty), many of these projects could capitalize on these natural views by upgrading outdoor living spaces.
2. Pennsylvania – 48,147 projects per 100,000 people
Pennsylvania comes in second with 48,147 renovations per 100,000 people. The state is known for its rich historical heritage and has an older housing stock, so this could contribute to its high rank. Many homeowners here are likely undertaking projects to preserve historical characteristics and modernize their facilities.
3. Ohio – 45,030 projects per 100,000 people
Completing the top three is Ohio, with 45,030 projects per 100,000 people. Ohio also has an aging home inventory and is one of the more affordable states for housing, so homeowners could be investing heavily in improvements.
With over $72 billion, California is spending more than any other US state
US states with the highest overall home improvement expenditure
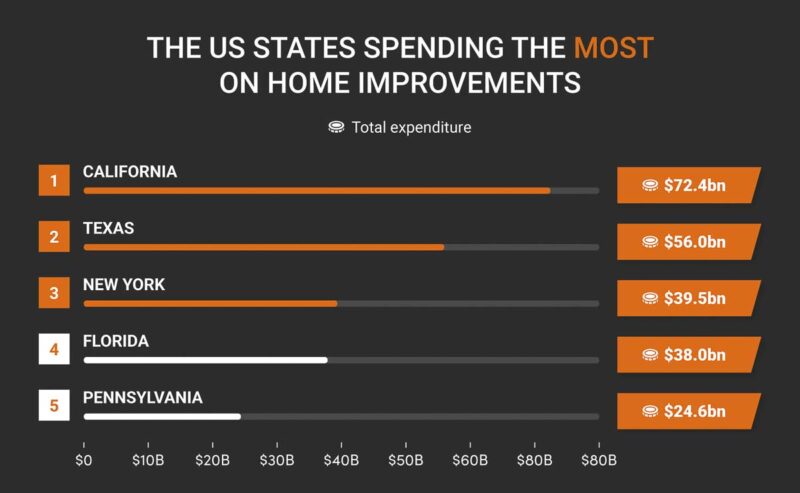

1. California – $72.4 billion overall expenditure
California takes the top spot on our ranking. According to the most recent data, there were over 12 million home improvement projects in the Golden State over two years, at an overall cost of over $72 billion and averaging around $6,000 per project.
2. Texas – $56 billion overall expenditure
Texas falls next on our list with the second-highest spending on home improvements. The $56 billion overall expenditure in this US state covers a wide array of improvement projects, from kitchen remodeling to full roof replacements.
3. New York – $39.5 billion overall expenditure
New York completes our top three, with a total expenditure of $39.5 billion. This state also has one of the highest average spends per project, at $6,435 across around 6.5 million projects.
With an expenditure of $14.3 billion, our data reveals Maryland as the lowest spender for home improvement costs
From the biggest spenders to the lowest, the following ranking on our home improvement trend report concerns the US states with the most minor expenditure for home improvements.
US states with the lowest overall home improvement expenditure
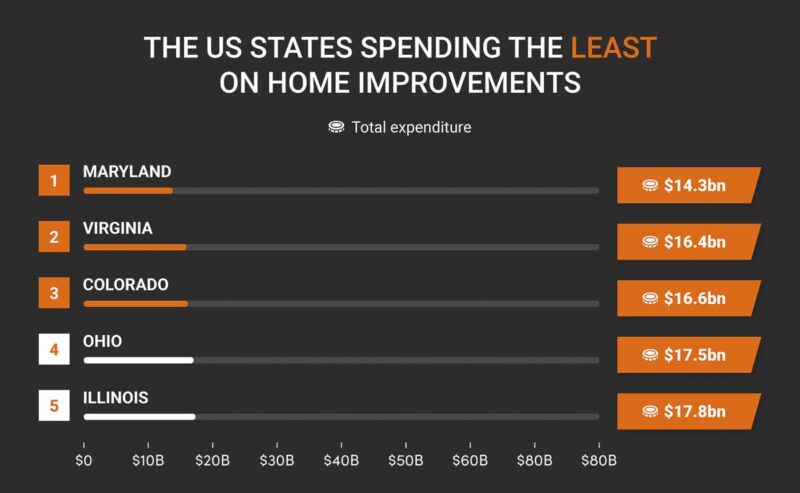

1. Maryland – $14.3 billion overall expenditure
Maryland spends the least on home improvements at $14.3 billion overall, although its average spend per project is higher than many states, at $5,487. This suggests that while people in Maryland may spend less overall, they may be making higher-value home investments.
2. Virginia – $16.4 billion overall expenditure
Virginians spent just $16.4 billion overall on home improvements, which is still substantial but puts them second from bottom on our list. On average, they spent $4,471 per project, among the lowest nationally.
3. Colorado – $16.6 billion overall expenditure
Just ahead of Virginia in terms of home improvement spending is Colorado, with an overall spend of $16.6 billion. However, like Maryland, its average spend per project is still relatively high, with a mean expenditure of $5,376.
Refinishing hardwood flooring will give you a better return than any other home improvement project, with a cost recovery of 147%
Along with enhancing your living space, home improvement projects can add value to a property, but which renovations are most worth the money? We ranked the percentage of value recovered from each project type. This is also known as “cost recovery” and helps you understand what home improvement projects constitute an actual investment instead of something you simply want to pay for to enjoy your home better.
Home improvement projects with the highest cost recovery
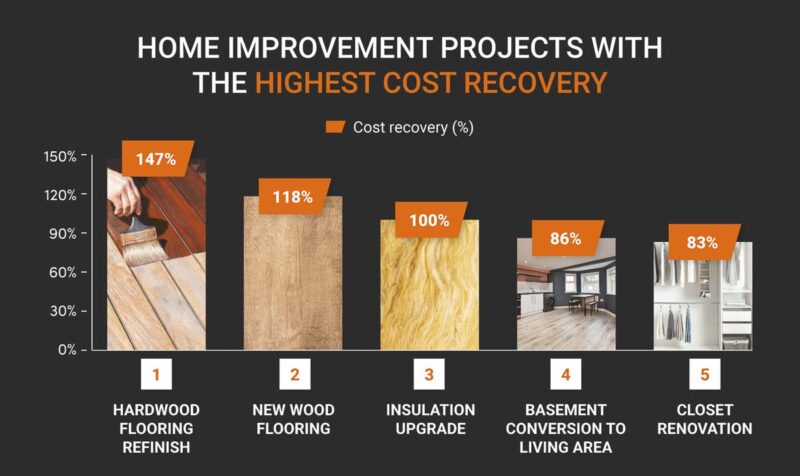

1. Hardwood flooring refinish – 147%
With a 147% cost recovery, hardwood flooring refinishing appears at the top of our list. Refinishing hardwood flooring involves sanding down the surface of your flooring to remove any deep scratches or marks before adding a new coating, helping to create a brand-new feel to your floor.
2. New wood flooring – 118%
Flooring-based home improvements seem to be the best way to increase the value of your property. Depending on the quality of wood used, new wood flooring can be costly, but according to recent data, this type of home improvement has a cost recovery of 118%. In most cases, refinishing a hardwood floor costs less than replacing it entirely, which accounts for its higher cost recovery. The decision to refinish or replace comes down to the quality of the wood on the floor and whether or not it’s already been refinished in its lifetime. Also, while refinishing is a job you might tackle on your own, replacing a hardwood floor is best left to a professional.
3. Insulation upgrade – 100%
With an estimated cost recovery of 100%, insulation upgrades have the second-highest value on our list. Based on these figures, this type of home improvement will have the same cost estimate as it does seller value. However, insulation is worth the investment as it can benefit homeowners by reducing energy bills and carbon dioxide emissions. New products like cellulose blown-in insulation make this a much easier process than installing batt insulation. Adding additional insulation to your attic typically results in the best overall energy savings in the United States’ North and South regions. The amount of insulation you should blow in depends upon where you live. We recommend R49 up to R60 in the far north and R30 to R49 in the extreme south. If you live in the middle somewhere, R49 is an excellent standard to maximize your energy savings.
Adding a new primary bedroom suite will give you the least bang for your buck, with a cost recovery of just 56%
As exciting as home renovations are, some can be more hassle than they are worth. To ensure you don’t lose out, the list below reveals which home improvement projects are the worst value for money.
Home improvement projects with the lowest cost recovery
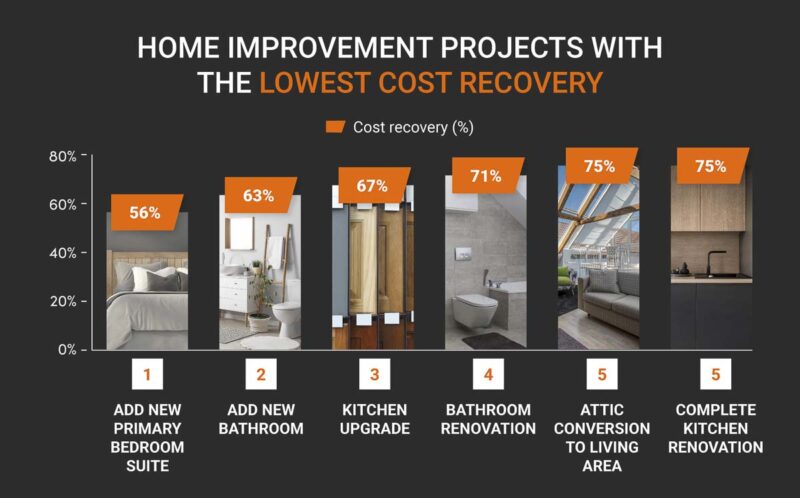

1. Add New Primary Bedroom Suite – 56%
Regarding cost recovery, adding a new primary suite to your home is the least financially secure. With a cost recovery of just 56%, the value received from this home addition may only be just over half of the project’s cost. The difficulty comes with the fact that adding on any room involves so much additional work. Framing, electrical, and roofing all play a part, and you end up with a higher overall cost that often doesn’t translate into a gain per the additional square feet added to your home.
2. Add New Bathroom – 63%
Next on our list, with a cost recovery of 63%, is the addition of a new bathroom. Many consider the bathroom one of the house’s most important rooms, but unfortunately, this value isn’t reflected in the cost recovery. Adding a bathroom to a home with only one existing bathroom is one exception. In most cases, this adds significant value to the house and makes it easier to sell eventually.
3. Kitchen Upgrade – 67%
From refinishing the floors to replacing the countertops and appliances, there are many things to consider when upgrading your kitchen, and the price can add up quickly. Considering this, it may be unsurprising that this home improvement project has one of the lowest cost recovery percentages on this ranking, totaling 67%.
Georgia is searching about home renovation more than any other US state, with 4,668 Google searches per 100,000 residents
The following ranking on our home improvement trend report reveals which US states have been searching for home-based renovation terms the most over the last year.
The US states with the most interest in home renovation
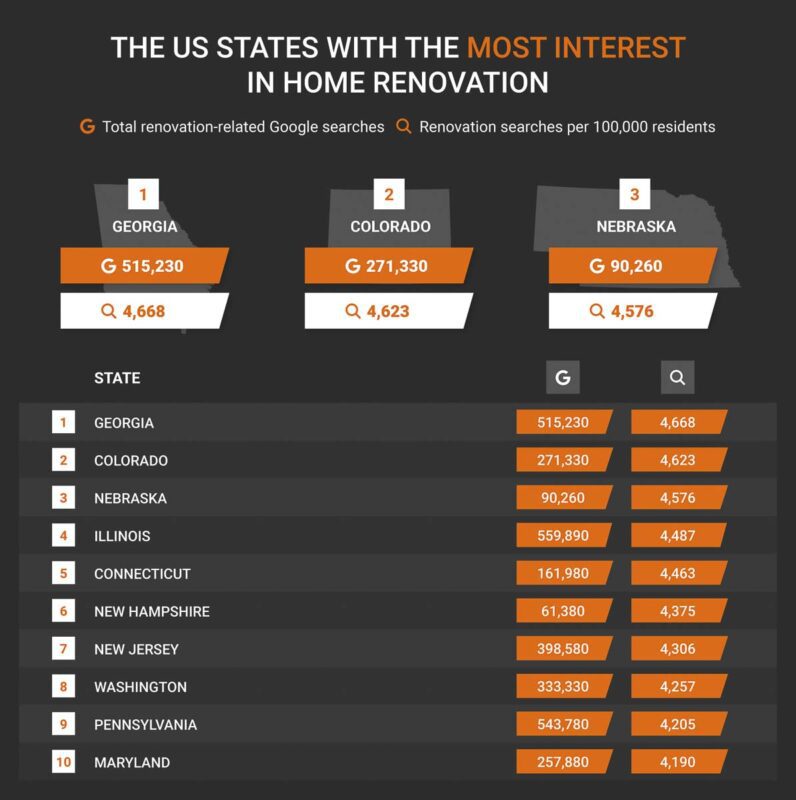

1. Georgia – 4,668 Google searches per 100,000 residents
Georgia takes the title of the most curious US state regarding renovation improvements. When considering population, the 515,230 total Google searches equate to around 4,668 per 100,000 residents.
2. Colorado – 4,623 Google searches per 100,000 residents
Colorado appears next on our list, with 4,623 Google searches per 100,000 residents. Of all the home improvement terms used, kitchen and bathroom remodeling were hot topics in this US state, and new home offices were among the least searched-for.
3. Nebraska – 4,576 Google searches per 100,000 residents
Nebraska completes our top three, with 4,576 Google searches per 100,000 residents. Despite having a much smaller number of renovation-related Google searches in the last year than the other entries in this top three, Nebraska has the third-highest number when population is considered.
Bathroom remodeling is the most popular renovation in the US, with over 4.6 million posts across Instagram, TikTok, and Google
Many of us take inspiration from social media, but which home improvement projects are trending the most online? Here’s what we found.
The most popular home improvement trends in the US
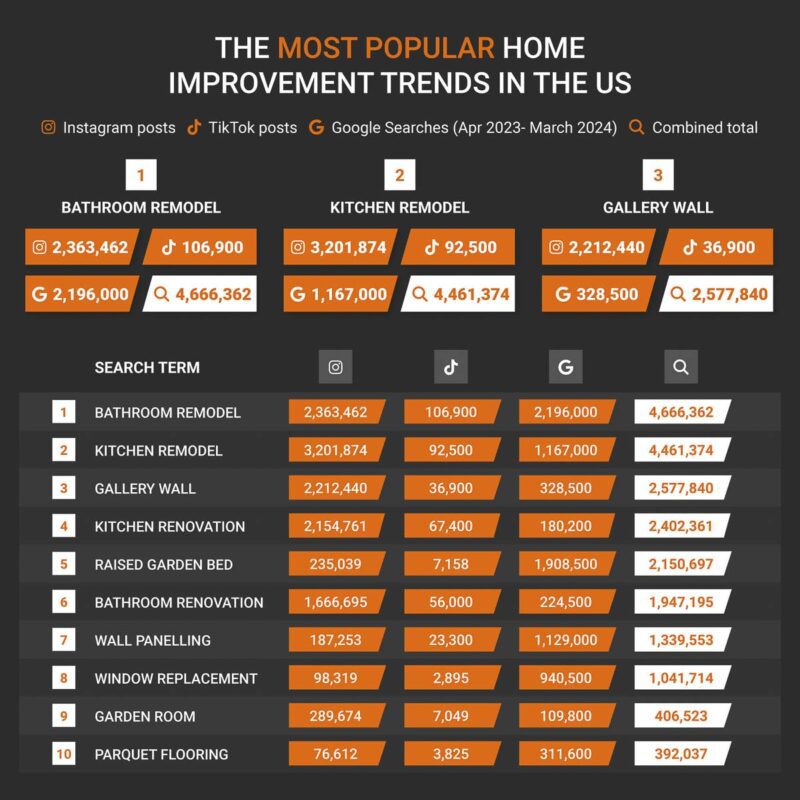

1. Bathroom remodel – 4,666,362
Bathroom remodeling is the most popular home renovation trend across Instagram, TikTok, and Google. Taking an underwhelming and old-fashioned bathroom and converting it into something slick and modern is a hit with viewers across both Instagram and TikTok, evidenced by the 2,363,462 and 106,900 posts on each platform, respectively.
2. Kitchen remodel – 4,461,374
Kitchen remodeling is all the rage on social media, particularly Instagram, tallying up over 3.2 million posts, the highest of any home improvement trend on our top three. The other contributing factors to this trend’s position on our ranking are the 92,500 TikTok posts and the 1.167 million Google searches in the last twelve months for the term ‘kitchen remodel.’
3. Gallery wall – 2,577,840
Completing our top three, with a combined total of more than 2.5 million posts across social media and Google searches, are gallery walls. When this figure is broken down, gallery walls have racked up most of its total through Instagram, with more than 2.2 million posts as of 2024.
A raised garden bed was the most searched-for home improvement trend in 56% of all US states
To understand which home improvement trends are peaking people’s interest around the country, we have compiled a list of the most searched-for terms in each US state. Here’s what we found.
Most popular home improvement trends across US states
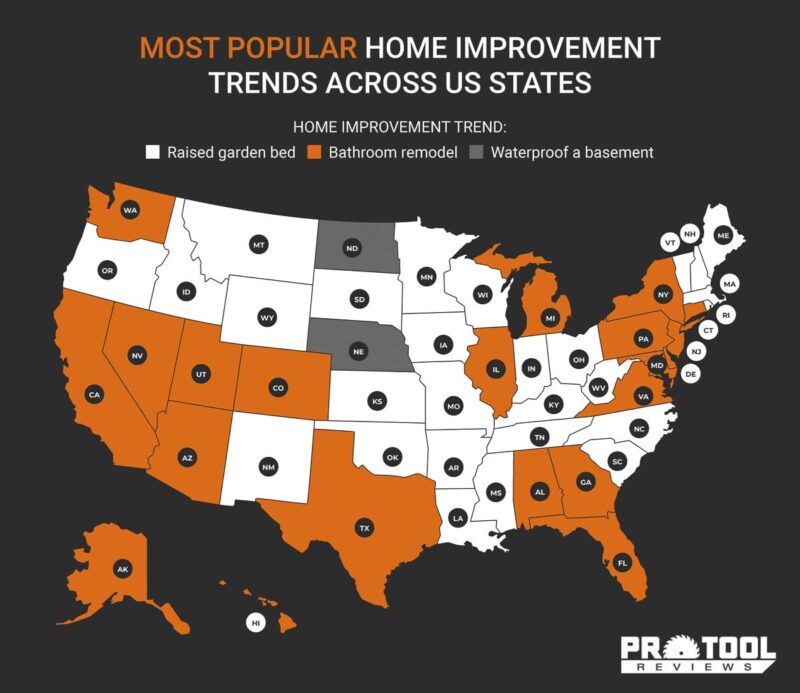

1. Raised garden bed – 28 US states
The most popular overall home improvement term across the US is ‘raised garden bed,’ with over half of all states searching for this more than any other. Across all 50 US states, raised garden beds have been searched almost 2 million times, with 92,000 coming from Wyoming alone.
2. Bathroom remodel – 20 US states
The popularity of bathroom renovation work has been highlighted earlier in this report. Some US states that are searching for bathroom remodeling include Utah, New York, Maryland, and Hawaii.
3. Waterproof a basement – 2 US states
The two US states that have searched for ‘waterproof a basement’ more than any other term are Nebraska and North Dakota, with 27,500 and 7,070 Google searches in the last twelve months, respectively.
Methodology
National Association of Realtors
We used Page 8 of the National Association of REALTORS to find the cost recovery for each interior remodeling project.
We ordered these from highest to lowest to find the interior remodeling projects with the highest cost recovery. Similarly, we ordered these figures from lowest to highest to find the projects with the lowest cost recovery.
United States Census Bureau
We used the United States Census Bureau to find the following data from the past two years. Data is as of 2021 or later unless specified otherwise:
- We filtered the table criteria by ‘National’ and ‘Home Improvement Costs.’ Then, we took the mean expenditure, number of home improvement projects, and total expenditure for each type of renovation.
- Filtering the table by US state and ‘Home Improvement Costs,’ we took the mean expenditure, number of projects, and total expenditure for the 11 US states that data was available.
- We divided the total number of home improvement projects by each state’s population (sourced from the US Census Bureau). We multiplied this by 100,000 to calculate the number of home improvement projects per 100,000 residents in each US state.
- After filtering the table by metro area and ‘Home Improvement Costs,’ we took the number of projects, total expenditure, and mean expenditure for each metro area for which data was available.
- We divided the total number of home improvement projects by each metro area’s population, sourced from the US Census Bureau). We multiplied this by 100,000 to calculate the number of home improvement projects per 100,000 residents in each city.
Google Keyword Planner
Then, making a seeding list of 75 different home improvement trends, we used Google Keyword Planner to find the total number of Google searches. We also looked at the year-on-year increase for each trend between April 2023 and March 2024. Lastly, we filtered these searches by ‘United States.’ Ranking these from highest to lowest, we found the current most searched-for home improvement trends in the US.
Using the above source but filtering it individually by state, we found the total number of Google searches for each trend for each US state between April 2023 and March 2024.
We added together the number of Google searches for each home improvement trend for each state. This gave each state a ‘total renovation-related Google searches’ figure. Dividing the total renovation-related Google searches by each state’s population, we multiplied this by 100,000 to calculate the number of Google searches per 100,000 residents in each US state.
We made a list of each US state’s most searched-for home improvement trend. Using this, we could calculate which renovation trends were most searched for by the highest number of US states.
Using the same home improvement trend seeding list, we searched for each renovation term on Instagram to find the number of posts using #(*renovation term*). We used this same process to see the number of posts on TikTok. All social media data was collected on 04/15/2024.


